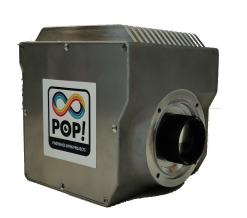
PRO-PIX
The ultimate hyperspectral camera for professionals who demand the highest level of performance, flexibility and robustness, built on compressive sensing technology with high hardware and software reconfigurability for the visible and near-infrared ranges.
Built for the field
PRO-PIX is designed for a wide range of applications in precision agriculture, food processing, geology and health care, following a real open innovation path from affordable dev kit to high-performance sensor.
Multi-sector applications
Designed for precision agriculture, food processing, geology and health care applications.
Open innovation path
Start with the affordable dev kit, develop your own methods, then transfer them onto a high-performance sensor.
Real spectral discrimination
Distinguishes clusters, background and dark reference across the 400 to 900 nm range, from a real PRO-PIX acquisition.
Raw signal, real decisions
The raw signal behind every classification and phenotyping result PRO-PIX produces.
From scene to decision, in near real time
PRO-PIX doesn’t capture a full hypercube for someone to comb through afterward. Its built-in RGB camera first segments the scene, on board, to find the zones that matter, a crop, a weed, an organ, a defect, a material, using a segmentation model tuned to your use case. An optical spatial modulator then physically reconfigures itself to address only those zones, the same hardware adapting to a tomato row, a rock face, or any other target. A dedicated analysis algorithm, classification, index, comparison to a reference, turns each measured spectrum into a result. Segmentation, reconfiguration, measurement and analysis all run on board, at more than 4 Hz: what leaves the sensor is a decision your team can act on, not a spreadsheet of reflectance values.

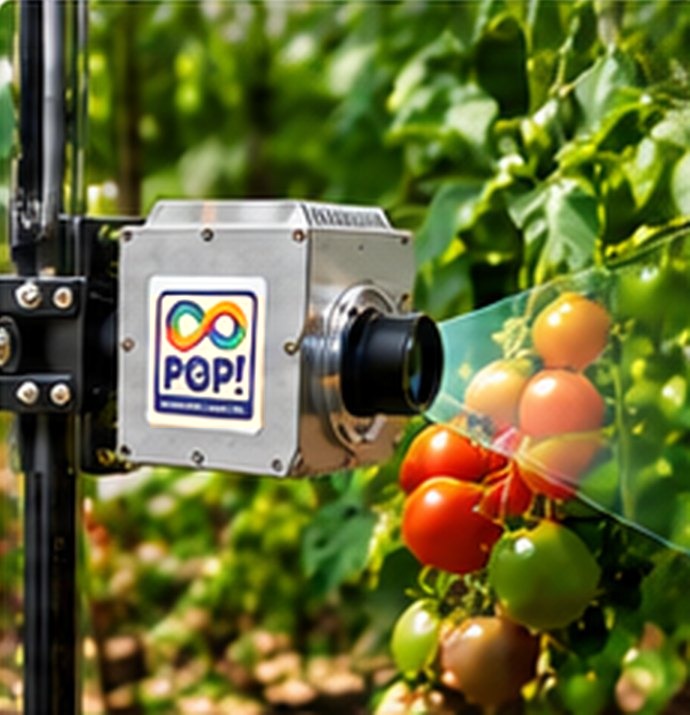
RGB image
PRO-PIX aimed at a truss of tomatoes
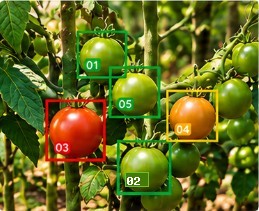
Fruit detection
Each tomato is located and isolated from leaves and stems
- Green
- Breaker
- Turning
- Pink
- Light red
- Deep red
Spectrum per fruit
A full spectrum is measured on every detected tomato only
HarvestWaitHarvest or wait
Ripeness indicators are compared to your harvest criteria, in real time
These indices feed a PLSR / ML model trained on reference fruit. As tomatoes ripen, firmness drops and sugar content rises: that combination is what turns a spectrum into a harvest decision. Ripeness reflectance curves adapted from a simulated reference dataset.
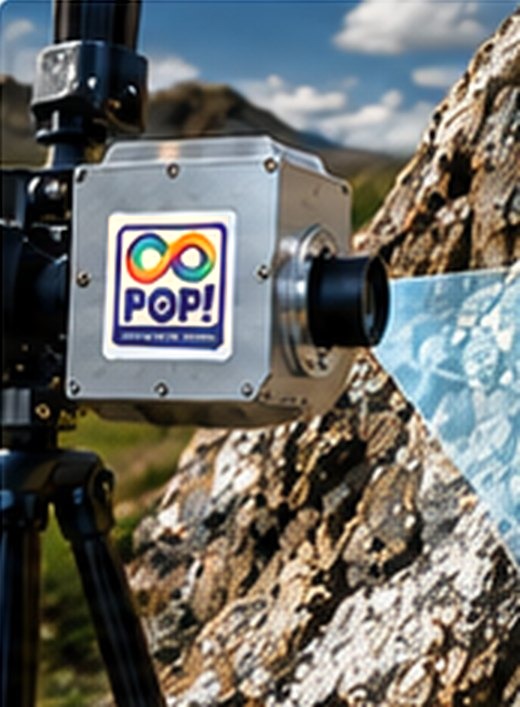
RGB image
PRO-PIX aimed at a rock outcrop, core, or mineral sample
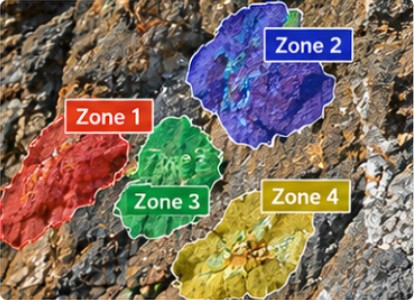
AI segmentation · ROI
The RGB image is spatially segmented into homogeneous zones, so only those are measured. No hypercube is acquired
- Kaolinite
- Montmorillonite
- Calcite
- Dolomite
- Hematite
- Goethite
- Quartz
Spectrum per ROI
400–2500 nm reflectance is measured only on each selected zone, then matched against reference minerals
Composition results
Each zone returns quantified compound concentrations, not a spatial map, compared against reference spectra
The ROI is matched against reference spectra, not guessed from RGB colour. Reference spectra shown above ≠ PRO-PIX measurements. Sources: USGS Spectral Library v7 (Kokaly et al., 2017); Hunt (1977); Hunt & Ashley (1979); Clark (1999).
Schematic illustrations of the PRO-PIX workflow. Spectral curves are simplified for clarity, inspired by published reference spectra, and do not represent experimental measurements.
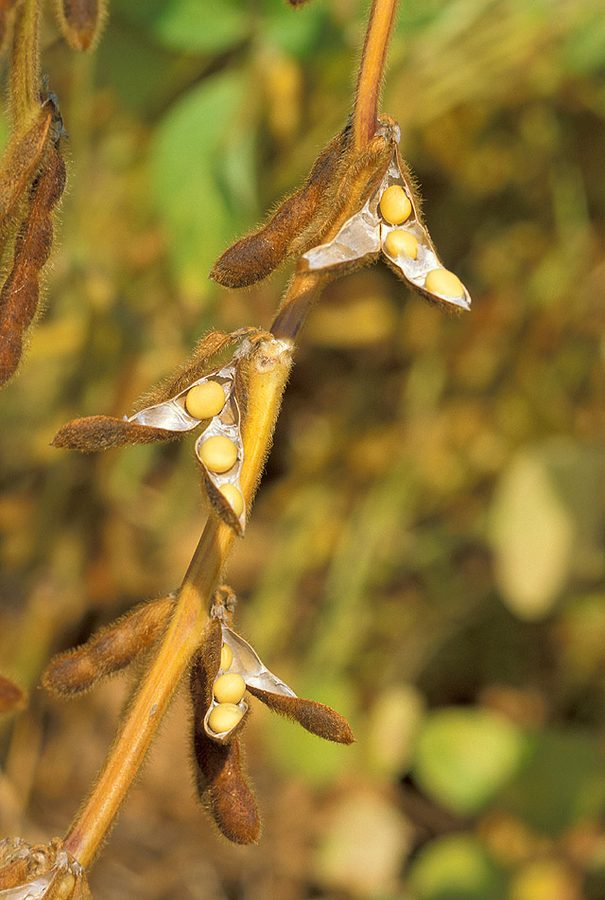
One sensor. Field-specific algorithms. Actionable spectral intelligence.
Precision agricultureChlorophyll strongly reflects near-infrared light and absorbs red light in healthy canopy; the ratio shifts under stress, which is what a vegetation index like NDVI measures.
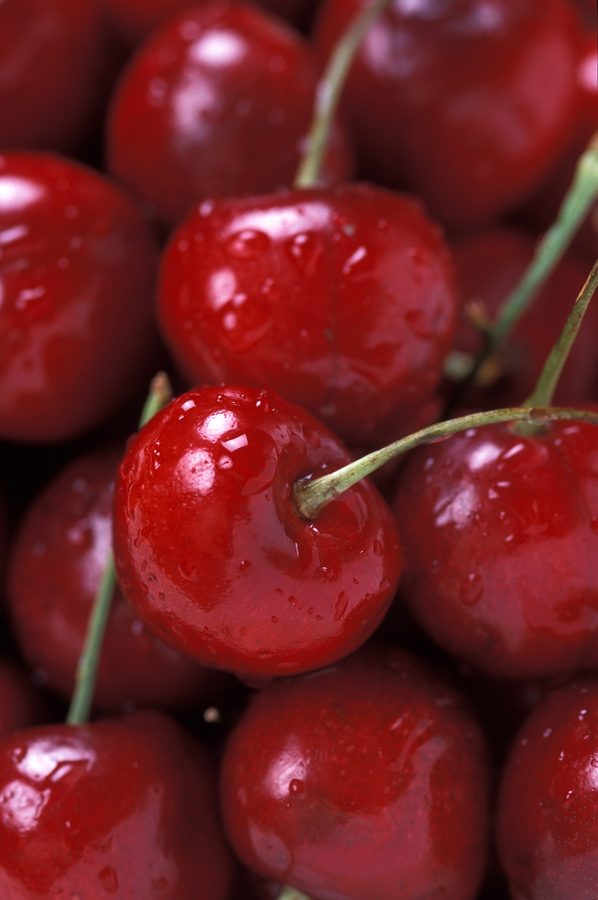
Food processingA published near-infrared model on sweet cherries predicted sugar content to within 0.7 °Brix and firmness with r=0.80, from 800-1700 nm reflectance alone.
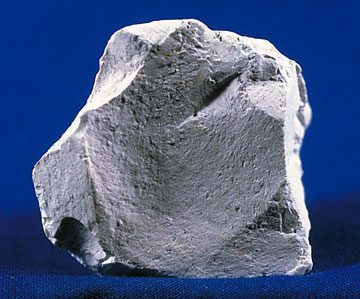
GeologyKaolinite's paired absorption features near 1400 nm and 2160-2208 nm are its diagnostic "fingerprint", letting it be told apart from other clays by spectral shape, not colour.
Health careWithin the 900-1300 nm window, water (~970 nm) and lipid (~1210 nm, the more clearly visible of the two) absorption bands let a sample's composition be characterized and classified without contact or preparation.
Illustrative spectral representations based on published scientific data and spectral reference libraries. Adapted for visualization - not direct PRO-PIX measurements.
Technical specifications
| PRO-PIX VIS/NIR | PRO-PIX SWIR | |
|---|---|---|
| Spectral range | 400 to 1000 nm | 900 to 1700 nm |
| Spectral resolution (typical) | 0.5 nm | 0.5 nm |
| Working distance | 1.5 m to infinity | 1.5 m to infinity |
| Field of view | 25 deg | 25 deg |
| Spatial resolution | 1080 px | 1080 px |
| Max measurement rate | 4 to 10 Hz | 4 to 10 Hz |
| Connector | GigE | GigE |
| Power supply | Battery / PoE | Battery / PoE |
| Control software | GUI, Python SDK, ROS | GUI, Python SDK, ROS |
| Dimensions | 125 x 90 x 90 mm | 125 x 90 x 90 mm |
| Weight | < 700 g | < 700 g |
| Protection index | IP65 | IP65 |
| Temperature range | 0 to 40 C | 0 to 40 C |
Download the datasheet or request a personalised quote.